MultiLab4

Real-time data analysis on any computer!


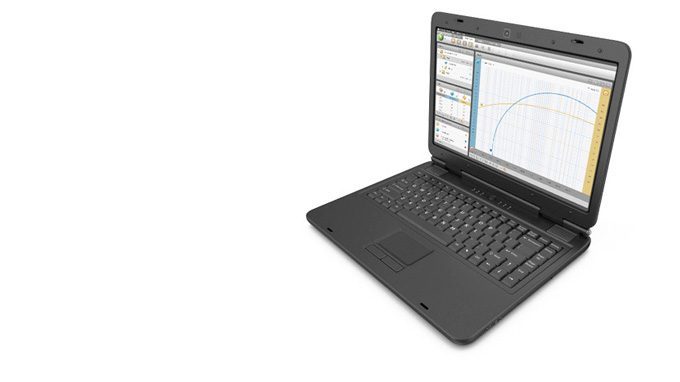
Makes science learning and analysis easier for your students, by providing them with user-friendly and intuitive tools to help them express their curiosity, creativity and collaboration in science.

Coming soon:

MultiLab4 is changing its name!

Features:

  • Streaming and display live sensor data
  • Collect data from multiple sensors simultaneously
  • View data in any of 6 different views
  • View and configure all sensors in one window
  • Calculate and displays the area between any 2 points
  • Analyze data with and array of mathematical functions
  • Sync data collection with video
  • Automatically analyze motion videos
  • Export data to Excel
  • Floating windows allow dynamic and fully customizable data view
  • Available for Windows, Mac & Linux
Why won’t MultiLab4™ connect to einstein™ Labmate™?
Make sure you have downloaded and installed the LabMate driver. You can do so from the MultiLab page of this website. If you did install the driver, check that the einstein™LabMate is turned on and make sure the Bluetooth connection is working properly. If it is, the Labmate’s indicator light should be flashing green and blue, if it is not, consult your computer manual for details on pairing your computer with Bluetooth devices.
Why doesn’t MultiLab4™ complete the data logging when running with a trigger?
Check to make sure the trigger condition has been fulfilled. Check to see that when the trigger condition was fulfilled, the time period was set to more than 300mS.
Why did my MultiLab4™ session end immediately after I started?
Check the sampling rate to make sure the session lasted more than one second.
Why is the recorded data “noisy”?
The main issue with “noisy” data – data which is unclear- is something interfering with the results. Make sure your lab area is clear of any unwanted objects or noises. Avoid working near strong electromagnetic fields. (e.g. engines, fluorescent lights ).
Why do I get unexpected data from a sensor I didn’t turn on?
By default, the internal sensors in einstein™Tablet and einstein™ Labmate+™ are turned on. If you don’t want this data go to Full Setup and turn unwanted sensors off by deselecting them.
Why don’t the results of a Run appear in a Graph or Table when I double-click on them?
In order to make the data of a Run appear in a graph or table, drag the Run to the graph or table.
I closed a graph or table. How do I get a new one?
Click on Workspace and then click on the Graph or Table button.
When I attached a sensor to einstein™Tablet or einstein™ Labmate™ it was not found. What do I do?
First go the Logger menu and try to select Connect. If it is still not registering select Full Setup from the Current Sensor Window and the select Manual from the Sensors dropdown menu.
What is Manual Sampling?
For some experiments the data collected does not need to be timed. For instance, if you need to take temperature readings at several different locations. In this case, select Manual from the Sampling dropdown menu. A new icon will appear next to the Run button. Click this button to collect the data.
How can I expand and contract the axis of a graph?
Point your cursor at either the X or Y-axis. It will turn into a double sided arrow. Drag the arrow to expand and contract the axis.