Weather Station
A weather monitoring tool that shows a dashboard of climate-related sensors
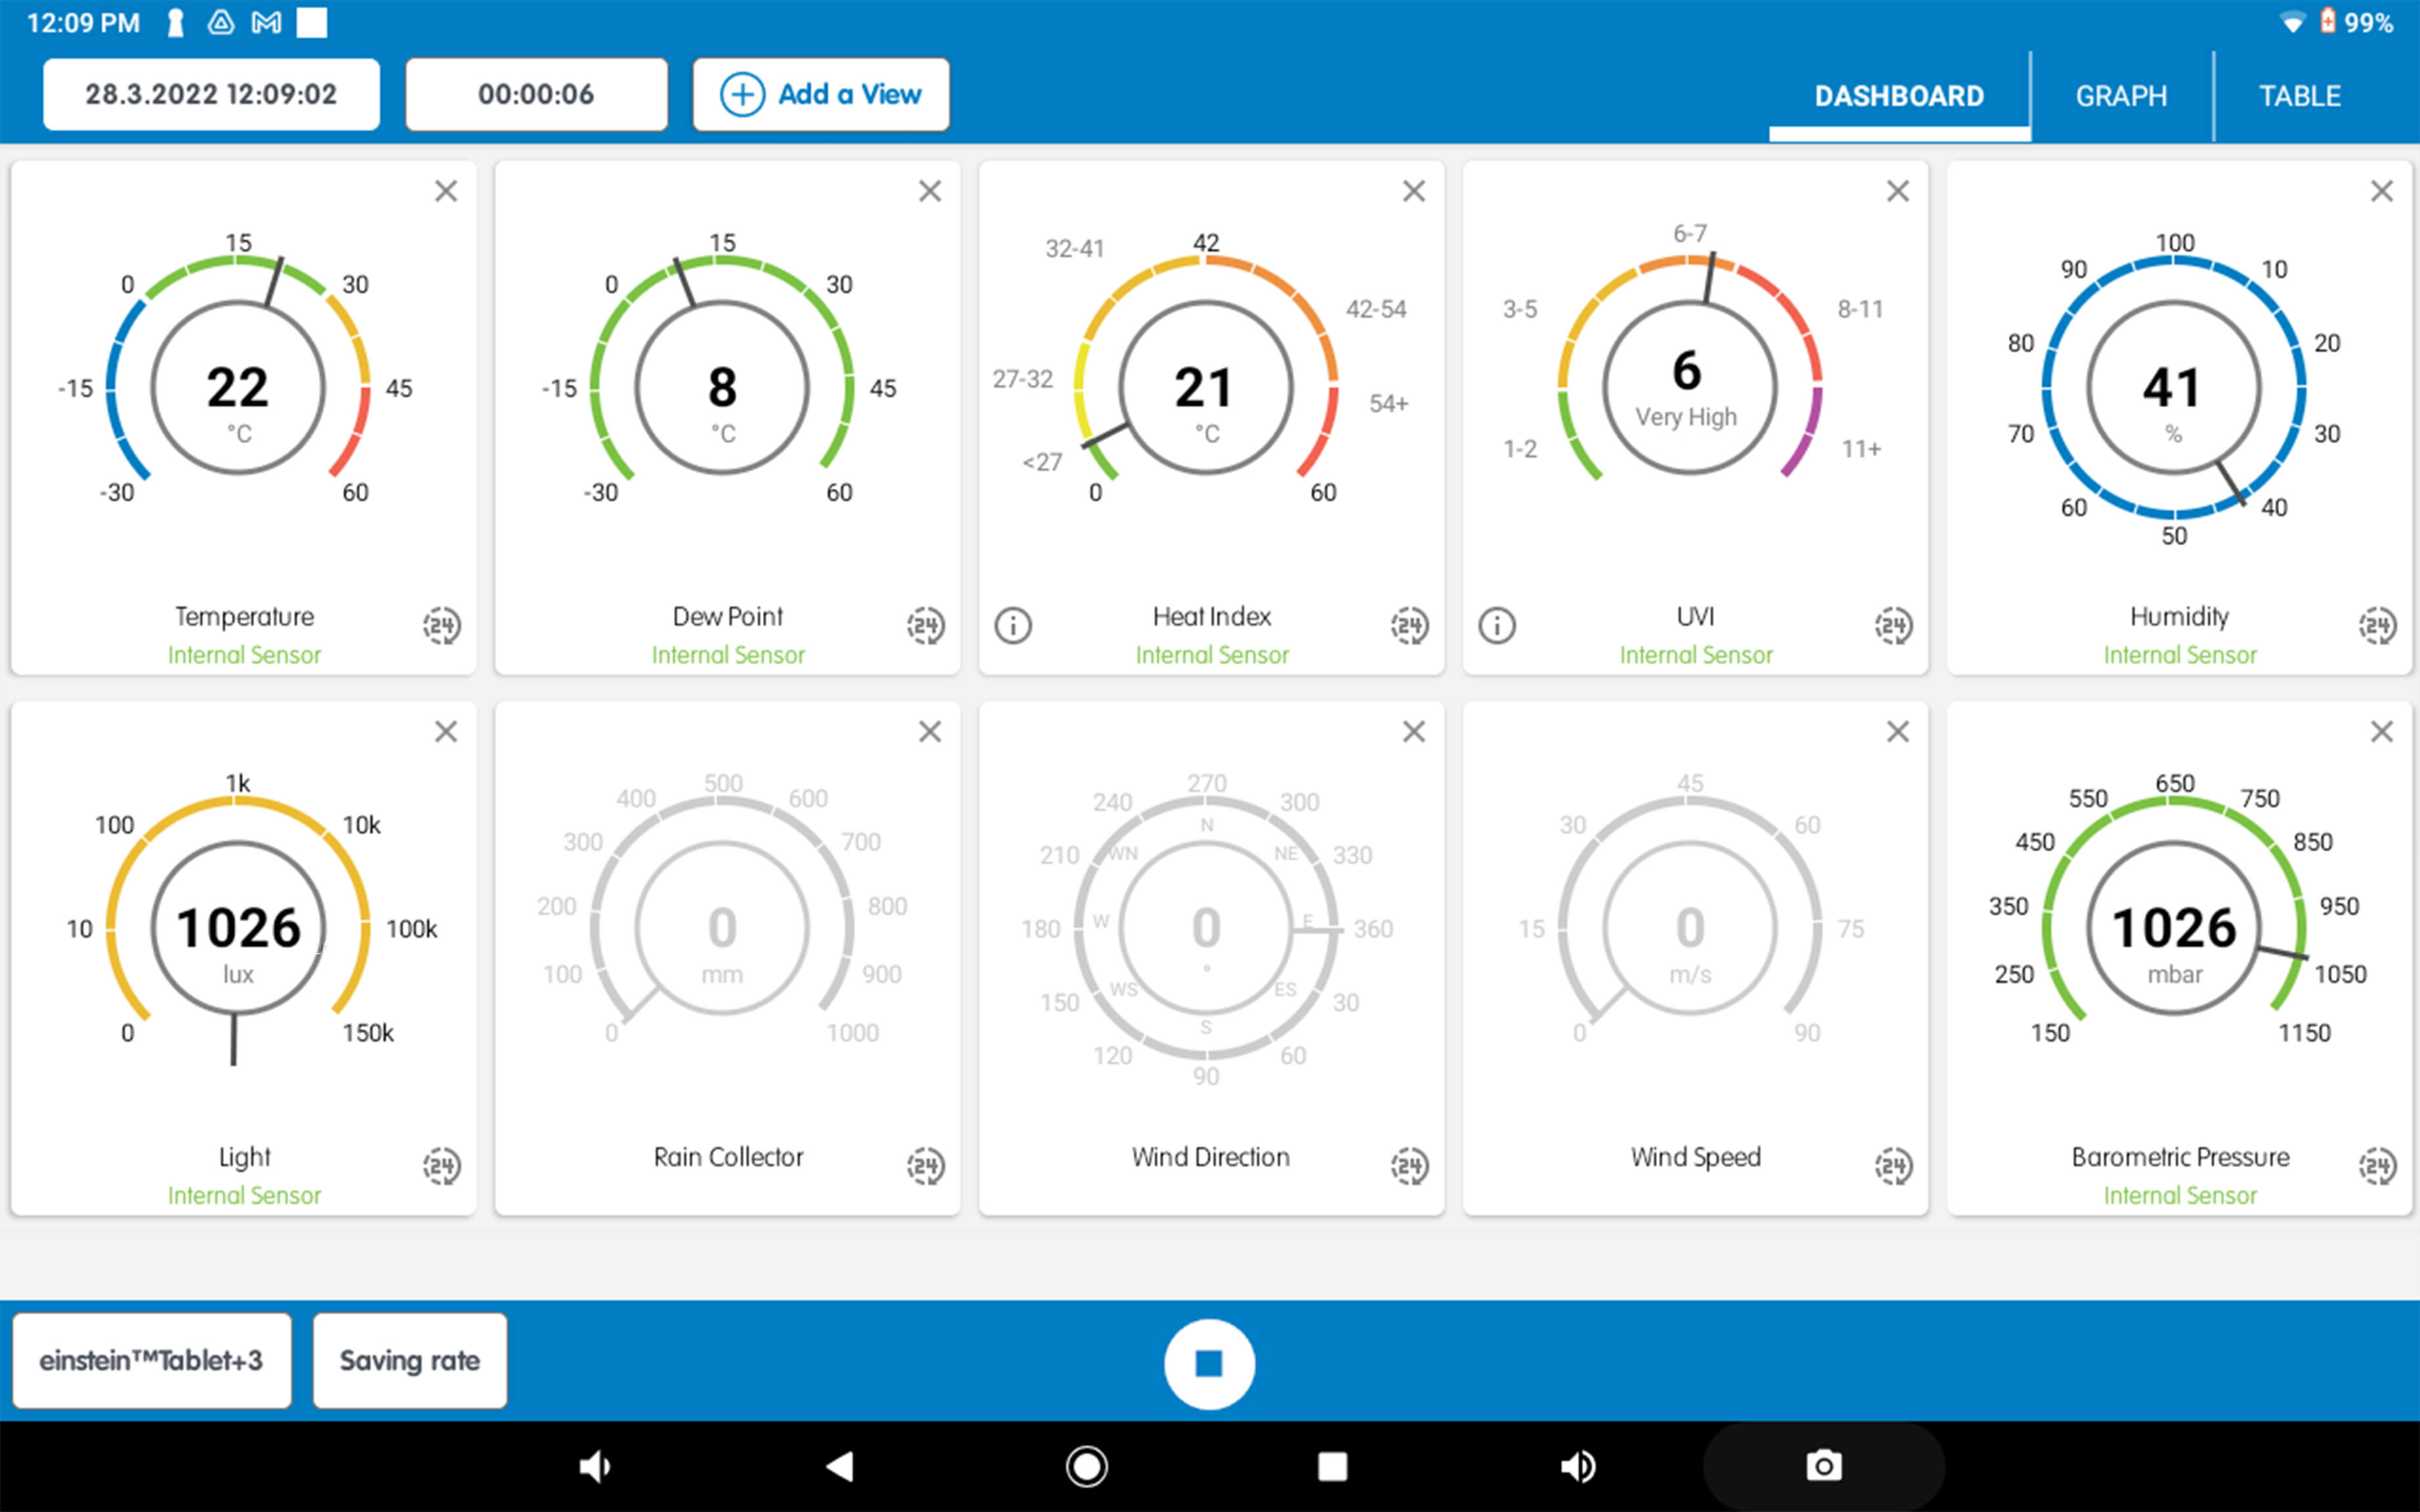
The “Weather Station” is a weather monitoring tool that shows a dashboard of climate-related sensors.
Its purpose is to enable teachers and students to visualize the weather status with chosen parameters,
such as temperature, humidity, barometric pressure, UVI, dew point, heat index, and more.
The einstein™ Weather Station data is measured by using the einstein™Tablet+3 or the einstein™LabMateII’s internal sensors
Use the MiLABEx Weather Station app for teaching activities:
- Explore different climate metrics connections: rainfall and temperature, rainfall and pressure, temperature and wind speed, etc.
- Add in visual observations of clouds (amount and type) of visibility, thunder, lightning, snow, sleet, hail, etc.
- Introduce different science concepts: water vapor as a gas, evaporation and condensation, atmospheric pressure, etc.
- Examine school microclimate: measure and compare the weather data in different parts of the school
- Examine how does weather varies each season

 ALBERT EINSTEIN and/or EINSTEIN are trademarks or registered trademarks of The Hebrew University of Jerusalem, represented exclusively by BEN Group, Inc., and are used with permission.
Official licensed merchandise. All rights reserved.